There are high costs to absenteeism. CCH Incorporated estimates that the direct costs of unscheduled absenteeism can cost up to $602 per employee. Indirect costs can make up another 25% including the costs of overtime pay, hiring temps, missed deadlines, lost sales, sinking morale and lower productivity.
Paid leave as benefits is sure a good talent retention strategy. But you got to know the impact it has on your business’s bottom line. 67% of people at small businesses (upto 500 employees), and 80% of people at larger businesses, have access to paid leave benefits.
At empxtrack we believe that organizations need to understand and manage their people well. Empxtrack’s integrated HR software represents this mission which allows people to manage the entire employee lifecycle in a single system of record. Empxtrack also provides trend analysis and enables people to gain deeper data insights. This helps in analyzing employee trend data, making informed decisions, and taking corrective steps (if needed)
Today, 260 businesses use empxtrack. On an average, 583 people work at these businesses. Using empxtrack, over 150,000 employees asked for more than 1.75 million leave records in last 3 years. Our analytics team found the results below, and wrote recommendations for businesses to manage employee leaves well.
Which month do employees take the most number of Paid Time Off?
Earlier last month, Sam Altman from YCombinator said “Summers are the best”, when reflecting upon his 36 life lessons on turning 30. With his success, he must surely be hinting at summers as the best time to work. At least, that’s what our records tell us.
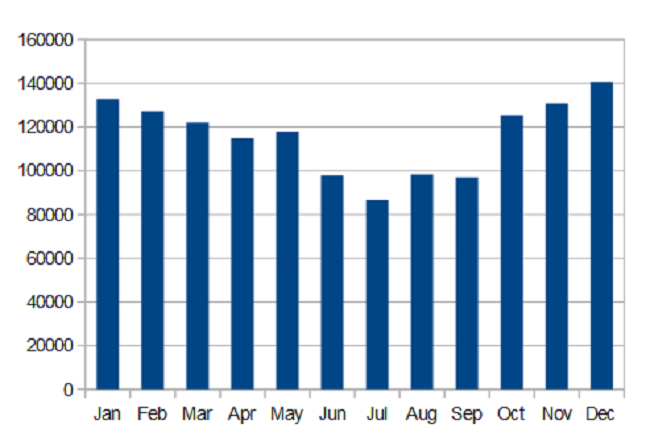
We noted the least number of records in the months of June to September, while most of the leaves were piled up around the New Year. Other than celebrating holidays, like in the United States, employees in India take leave around the New Year to avoid a lapse of leave days at the end of the year.
The holiday hangover lurks around in January and February, as people receive leave credits in the new year.
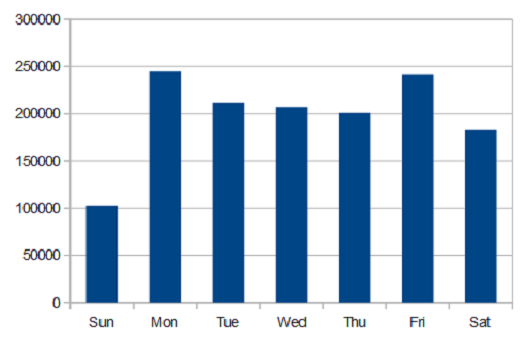
Which days of the week are most employees on leave?
Most people club their weekend with a leave day to enjoy a “long weekend”. Friday and Monday peaked in our analysis of leave records for the week. The least number of leave records were on Thursdays.
How long are people on a leave?
We broke down leaves into day leaves (1 day), short leaves (3 days avg.), and excursions (12 days avg.). And this is one of the most interesting insights we had.
We have been hearing that HR spends a lot of time in daily administration. The graph below should tell you where they are stuck.
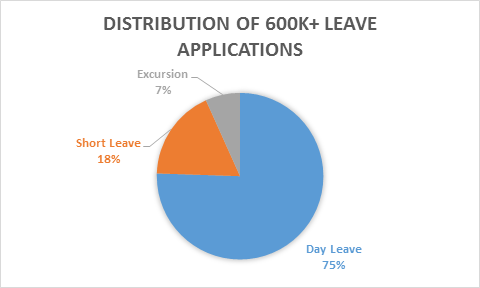
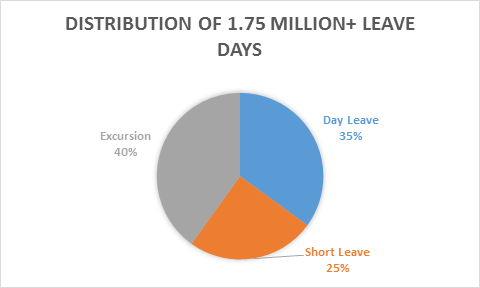
75% of all applications that HR processes are for a single day leave. If you’re managing it on paper and through traditional measures, this means distraction and disruptions for employees, managers and the HR staff alike. Net Result = Lost productivity
PRO TIP: Using a leave management tool can help you remove the manual paperwork and make your people more efficient. Employees can check if their leave has been approved or not, instead of bothering HR or manager on its status. Managers can approve or deny leaves from their mobile phones. The best products also provide a Bradford Factor Dashboard that helps you measure employee absenteeism.
“Short term absence disrupts organization’s performance than single prolonged absence “
What are the Different Types of Paid Time Off employers offer?
Most organizations have 3 – 4 different types of leave. Our customers use empxtrack in the United States, Middle East and India. The names that employers use for different types of leaves vary across these geographies. Here’s how we have defined it.
Casual Leave: Paid time off that lapses at the end of the year.
Earned Leave: Paid time off that can carry over to the next year and can be enashed.
Compensatory Off: Eligible when an employee works on a holiday or works overtime and gets an extra day off. Also called In Lieu off.
Leave without Pay: When an employee does not have leave balance, they may apply for this leave.
Medical Leave: This includes sick leave, maternity leave, paternity leave and bereavement
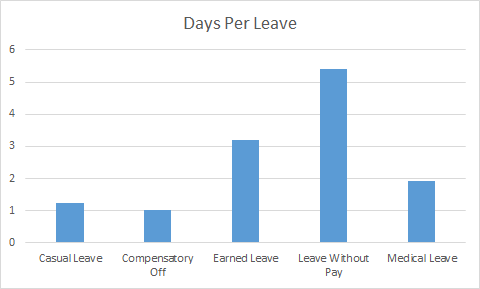
When we compared the number of applications to the total number of leave days for each leave type, this interesting graph comes up. People take the longest leaves on Leave Without Pay and the lowest on Compensatory Off.
This is intriguing, isn’t it? Why do people take longer vacations when they are not being paid for it?
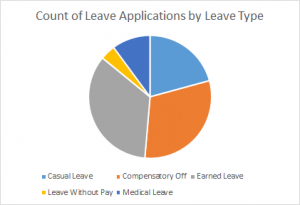 | 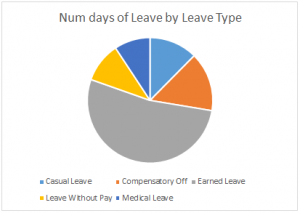 |
When we compare the count of leave applications for different leave types with the total amount of leave for that leave type, there are some interesting insights
– The maximum number of leave days are for Earned and Casual leave, both paid time off (65%) but these constitute only 55% of the leave applications.
– Earned leave days are about 4 times that of casual leave (probably because North America does not offer this leave type).
– Compensatory off has about 30% of leave applications but includes only 15% of leave days.
– 10% of all leave is unpaid leave.
– Medical/Sick leave has about 10% of applications and about 10% of all the leave days.
This again tells us that an online leave management tool can help in significant reduction of HR workload.
Stay tuned in for our next blog where we share answers to the questions above. And trust us, this is a long series of very interesting data-driven articles that share insights from our 10 years of experience managing HR across the world.


Hello, I enjoy reading through your post. I wanted to write a little comment to support you.
Thank you so much for this educative post. It contains a lot of useful information and I really appreciate it