Performance Potential dashboard displays the performance potential of employees to different stakeholders. Configure Performance Potential Settings to compare any two performance appraisal forms against their rating scale. For instance, the performance of both Goals and Competencies for an employee is shown on a single graph.
Note: The steps mentioned below are of Empxtrack Enterprise product.
Configure Performance Potential Dashboard
To configure performance potential settings graph, you need to:
- Log into the system as HR Manager or Administrator.
- On the Homepage, click on the Product configurations tab.
- In the Performance Management section, click on the Performance Potential link. The page appears as shown in Figure 1.

Figure 1
- By default, the checkbox with Enable performance potential graph option is checked. If it is not done, select the checkbox if you want to show the potential dashboard.
- Select the Form type that you want to display on the X-axis from the X-axis dropdown and then select the form that you want to select on the Y-axis form from the Y-axis dropdown.
- Select the rating scales used on the selected forms from their corresponding forms from the Rating dropdown.
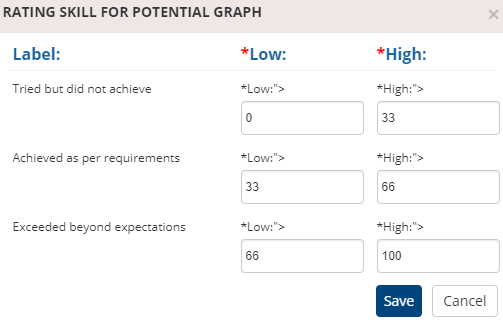
- Click Manage rating skill for X-axis link to manage the rating scale values of X-axis for the graph. Rating Skill for Potential Graph appears as shown in Figure 2. This displays the selected rating scale values (Goalsheet in this example) with their lowest and highest range.

Figure 2
- Modify the highest and lowest range values in the Low and High columns for each rating scale value, if required.
- Click Save. The values you have provided for X-axis of the graph are successfully saved.
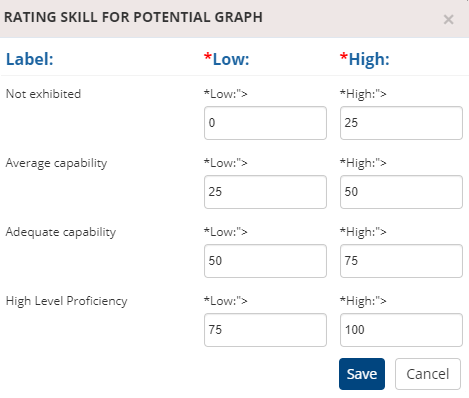
- Now click Manage rating skill for Y-axis link to manage the rating scale values of Y-axis for the graph and modify the graph values in the Rating skill for Potential Graph window that appears. Click on the Save button.

Figure 3
- Once the ratings for both X and Y axis are set, click on the Save button. The settings for the graph are successfully saved and a message suggesting the same appears.
View Performance Potential Dashboard
The Performance Potential Graph can be seen by following the path:
1. Log in as an HR Manager.
2. In the Home page, go to Measure tab and click Performance Appraisals section. A new page appears where you can view Performance Potential Dashboard under Performance Appraisals.
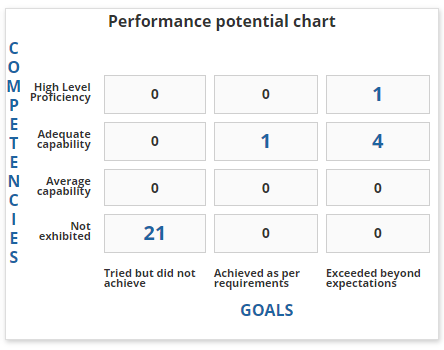
3. Select the preferred options from the Timeperiod and Appraisal tag dropdown to view performance potential graph of your team members for the required timeperiod. The performance potential dashboard appears as shown in Figure 4.

Figure 4
The graph displays the rating scales for X-axis and Y-axis and the number of employees that fall under those rating scale values.
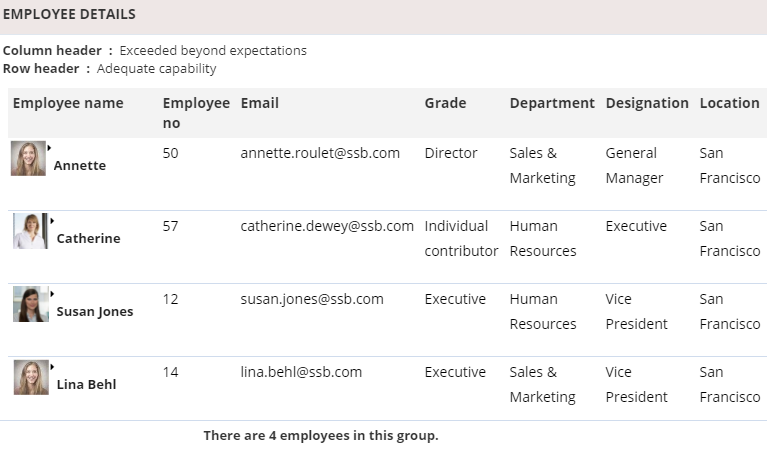
You can click on the numbers appearing in the graph to see the details of the employees that fall in those values. For instance, click on the numeric “4” with column header as Exceeded beyond expectations and row header as Adequate capability. The details of the employees appear in a new window as shown in Figure 5.

Figure 5
Learn more about Empxtrack Performance Appraisal
Click on any of the following links to know more about them
- Setup Performance Appraisal Plans
- Initiate Appraisal
- Change Appraisal State
- Configure Performance Potential Settings
- Appraisal-Employee Access
- Manage Team Appraisal – Filter Records
- Print Appraisal
- Manager Appraisal Dashboard
- Create a new Rating Scale


